- Energy & carbon projected – 5, 10, 20 years
- Energy efficiency health check
- Grants for energy efficiency
- Partner focus: Carbon Training International (CTI)
- A greener ferry service
- Team news: Scott McIntosh heads up WA
Missed our last newsletter?
Energy & carbon projected
5, 10, 20 years… taking a longer view
Last newsletter we promised to review one of our newer services: Strategic Energy & Emissions Management (SEEM). We are now helping our clients project energy and greenhouse gas emissions, 5, 10, or 20 years into the future. They can now overlay policy and technological scenarios, forecast the impact, and accurately create a strategic roadmap.
SEEM helps our clients take a longer view and plan for a carbon constrained future. Currently we are working with a range of organisations, from local governments to aged care providers and professional services practices.
We create a picture of each client’s energy consumption and carbon emissions profiles in the years to come. We use a range of analytical methods to first establish a baseline and then estimate future patterns. We take into account the relative intensity of a variable, such as population growth, occupancy, net revenue, or square metres. Internal and external scenarios include:
- Long term targets and objectives
- Operational changes and infrastructure improvements
- Efficiency project pipelines
- National and international energy and emissions policies and agreements.
Through SEEM we also evaluate the specific impact of carbon trading schemes, their direct and indirect costs.
Revise targets as required
Using Pangolin’s projection tool, numbers are easily manipulated to revise targets or account for changes in economic or political conditions. We present numerical data in a clear, easily comprehended chart format. This allows our clients to visualise energy and emissions trends over a selected timeframe, for example, the next 5, 10 or 20 years, until 2020, etc.
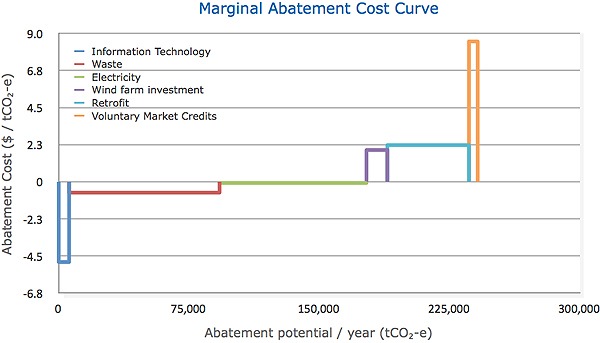
With the resulting profiles, our team identifies and collates energy and emissions abatement projects, establishing near and long term feasibility. From a helicopter view to site specific detail, we plot these measures on a marginal abatement cost curve (MACC).

The MACC clearly shows the most cost effective means of reducing energy and carbon. It enables prioritisation of projects and accurately refined budget allocations.
An example: a recent abatement projection
Recently a MACC demonstrated that installing a co-generation system would give our client, a local government in NSW, the greatest potential for abatement at a reasonable cost per tonne of carbon dioxide equivalent (CO2-e). This proved more cost effective than upgrading to energy efficient lighting. Co-generation was also a better choice than the higher abatement potential of small scale renewable energy implementation and an air conditioning plant fit out. The latter would require substantial change to infrastructure and abatement at a much higher cost.
Energy efficiency health check
Spending too much on your energy bill?
 Power bills are tipped to double by 2020. Everyday we hear that businesses are feeling the pinch from rising costs of electricity.
Through our Energy Audits we typically identify annual cost savings of $50,000 – $100,000 per annum for energy intensive businesses – more for manufacturers. Where to start? Take our Energy Efficiency Health Check.
- Do you spend more than $30,000 per year on energy (electricity and gas)?
Yes? Go to question 2. No? A formal energy audit may not be cost effective for you. - Have you had an Energy Efficiency Audit for your business in the last 3 years, and implemented the recommendations?
Yes? If so your business is probably running efficiently. Technology changes rapidly, though, and with rising power prices, the return on investment on some recommendations not implemented for a variety of reasons may be viable now. E.g. Some payback periods may be worth reassessment. For energy intensive users we recommend an annual audit review. For all others, we suggest a re-audit every 3 years. No? Go to question 3. - Why not? Take a look at a few Energy Audit facts below:
Energy Audit facts
On average we have identified annual saving of over $136,000 for our manufacturing clients.
For most clients we have identified savings in excess of $50,000. This is obviously limited by current annual spend on energy. For many the identified savings exceed $100,000 per annum.
The average payback on all recommendations is under 3.6 years.
This includes all of our recommendations. Some would not be implemented due to long payback periods but we identify them for future consideration.*Access to government funding can reduce the payback by up to half on many recommendations. Other recommendations may be solving a wider business issue.
Total site energy reduction of over 20% has many benefits.
E.g. Reduced demand charges and the ability to renegotiate peak demand. The latter translates into smaller energy bills. In some cases we have managed to reduce the site demand, removing the need for a costly transformer / site supply upgrade. This may also allow additional expansion previously constrained by the energy supply to the site.
Government funding is available for energy efficiencies.
Talk to us about getting access to government and / or state funding. An Energy Audit and efficiency strategy is usually required for the application. We’ve helped a number of our clients with grant applications. Some have already been successful. Others are in progress.
Grants for energy efficiency
Pangolin helps win grants – almost $1.4 million to date

A number of our clients have applied for clean energy funding, and between them have won almost $1,400,000. At the moment government funding for energy efficiencies is generous.
Are you eligible?
Take a look at the Clean Technology Investment Program, part of the Australian Government’s Clean Energy Future plan. Generous grants are now going to many energy intensive businesses.
How we help with grants
An energy audit and energy efficiency plan is prerequisite for most government funding. We help grant candidates with a professional audit, recommendations and an overall strategy to put forward.
Also win with cost savings
Clients who have implemented our recommendations are winning each year through cost savings.
Savings for manufacturing clients are typically more than $130,000 per annum. For most other industries we typically identify savings between $50,000 – $100,000 per annum, with a payback of about 3.6 years. *Government funding may reduce the payback period substantially.
Looking for more information?
- See more in this newsletter: Energy efficiency health check
- Read about our Energy Audits
- Back to top
Partner news
Carbon Training International (CTI)
Understanding the complexities of carbon management is a competitive advantage. Carbon Training International has an extensive network of trainers building programs in Australia and overseas.
As well as these accredited workforce programs, we work with CTI on joint projects to help our clients reach their goals faster. Educating staff is key for a more sustainable and accountable work place, so we are happy to recommend CTI for in house training.
A greener ferry service
Two years on: 83% take up, 177 tonnes of greenhouse gas emissions.
 In January 2011 Pittwater’s Church Point Ferry Service introduced a Green Ticket program. This was a first in NSW public transport, and a success from day one. The ferries (and ferry passengers) have offset 177 tonnes of greenhouse gas emissions through certified carbon credits. They’ve also planted 177 native trees.
About the ferry service:
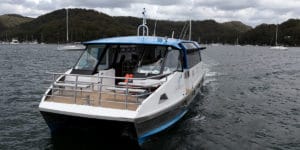
Three diesel-run ferries transport offshore commuters to the mainland from Scotland Island and the Western Foreshore Bays of Ku-Ring-Gai Chase National Park. This is a critical service for Pittwater’s boat access only community of approximately 2000 people.
In late 2010 ferry owners Penny Gleen and Simon Wastell consulted Pangolin Associates for help. They decided it was time to lower the business’ footprint. Ferries run every day of the week, 365 days a year, so fuel by far had the heaviest toll on the environment.
How the Green Ticket works

Passengers can choose to pay an additional $1 for a 12-trip pass ($60). Most of that dollar offsets the ferries’ fuel through the purchase of certified carbon credits. The rest goes to Australian reforestation.
Commuters purchasing the Green Ticket offset more than 100% of emissions attributable to their own trips to and from the mainland. Put another way, through the ferry service, participants in the program have reduced their personal carbon footprint.
Two years on, Green Ticket take up has exceeded 80% each quarter. It has also inspired similar ticket-based organisations, such as Palm Beach Ferries, to do the same.
Team news
Scott McIntosh heads up WA
 Meet Scott McIntosh, Pangolin State Manager, Western Australia. Scott heads up our growing business in WA from Perth. His clients range from SME’s to corporate entities such as mining and oil. Scott also works closely with a network of strategic partners in WA, including The Master Builders Association, Enterprise Connect and leading accountancy firms.
As well as in depth knowledge of the carbon issues confronting businesses, Scott is himself a greenhouse gas auditor. He is also an educator. Scott has designed a Diploma of Carbon Management with the West Coast Institute of Training. He lectures at the Institute and runs regular events on carbon management for the financial services sector.
Scott has global experience. He has worked in both the UK and Europe.
